When running a business, understanding how money flows in and out is crucial. QuickBooks helps with this by providing reports and analytics that show how your business is doing financially. Let’s dive into how to use these tools to make your business better.
Understanding QuickBooks Reports
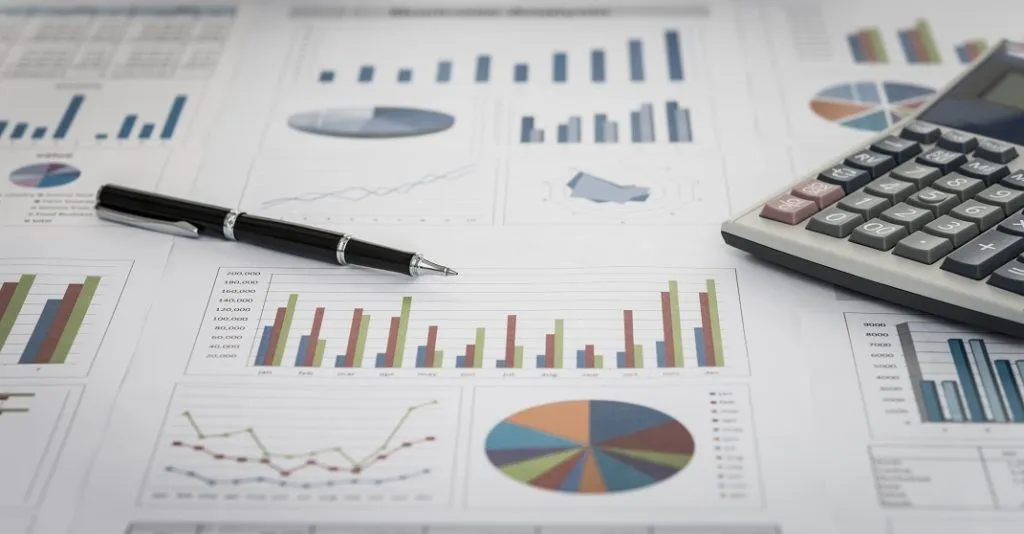
QuickBooks reports are like a detailed snapshot of your business’s financial health. They show where your money is coming from and where it’s going. These reports help you see how much profit you’re making, how much you owe, and how much is owed to you.
Key Reports to Use:
- Profit and Loss Report: This report shows if your business is making a profit or losing money. It lists all your income and expenses. By looking at this report, you can see if you’re spending too much or if your sales are not high enough.
- Balance Sheet: The balance sheet tells you what your business owns and owes. It lists your assets (like cash and equipment), liabilities (like loans and bills), and equity (the value left after subtracting liabilities from assets).
- Cash Flow Statement: This report shows how cash moves in and out of your business. It helps you understand if you have enough money to pay bills and make investments.
How to Use These Reports:
- Track Progress: Regularly check these reports to see if you’re meeting your financial goals.
- Make Decisions: Use the data to decide if you need to cut costs or find new ways to increase income.
- Plan Ahead: Forecast future performance based on past reports to prepare for any financial needs.
Analyzing Data with QuickBooks Analytics
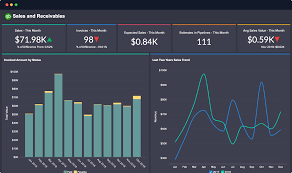
Analytics in QuickBooks provide deeper insights into your financial data. It’s like using a magnifying glass to look closer at the numbers. These tools help you understand trends and patterns in your business.
Key Analytics Features:
- Financial Ratios: Ratios like profit margin and return on investment help you measure financial performance. For example, the profit margin shows what percentage of sales turn into profit.
- Trend Analysis: This looks at financial data over time. By seeing if sales are increasing or expenses are growing, you can spot trends and make adjustments.
- Budget vs. Actual Reports: Compare your actual performance to your budget. If you spend more than planned or earn less, this report will help you find out why.
How to Use Analytics:
- Identify Trends: Spot patterns in your sales or expenses to make smarter decisions.
- Improve Efficiency: Use insights to streamline operations and reduce unnecessary costs.
- Make Strategic Choices: Base your decisions on detailed data rather than guesswork.
Customizing Reports for Better Insights
QuickBooks lets you customize reports to fit your needs. This means you can focus on specific areas of your business that matter most to you.
Customization Options:
- Filter Data: Choose which data to include or exclude. For instance, you might only want to see sales from a particular region or product.
- Add Columns: Include extra information in your reports, such as customer details or payment terms.
- Create Templates: Save your custom settings as templates to use them again later. This saves time and keeps your reports consistent.
How to Customize Reports:
- Set Priorities: Focus on what’s most important for your business goals.
- Save Time: Use templates and filters to quickly generate the reports you need.
- Get Detailed Information: Adjust reports to provide insights that are relevant to your specific business needs.
Using QuickBooks Reports to Drive Business Growth
QuickBooks reports and analytics are not just about keeping track; they are tools for growth. By regularly using these features, you can drive your business towards greater success.
Strategies for Growth:
- Monitor Key Metrics: Keep an eye on important financial metrics to ensure you’re on track.
- Adjust Strategies: Make changes based on what the reports and analytics are telling you.
- Set Goals: Use insights to set realistic financial goals and measure progress.
How to Drive Growth:
- Stay Informed: Regularly review your reports to stay updated on your business’s financial health.
- Make Data-Driven Decisions: Use the information from reports and analytics to guide your business strategies.
- Plan for the Future: Use past data to forecast future performance and plan for upcoming challenges.
By leveraging QuickBooks reports and analytics, you can get a clear picture of your business’s financial performance. This helps you make informed decisions, optimize your operations, and ultimately, drive growth.